by Kenneth Powell | Jun 18, 2024 | Calvert County Market Info, Uncategorized
According to the low monthly supply of 1.47, the real estate market in Calvert County, Maryland, is currently showing signs of strong demand and limited inventory. At the current sales rate, it would take slightly more than a month and a half to sell every house currently listed. Notable is the 12-Month Change in Months of Inventory, which displays a 13.53% drop from the prior year, suggesting a tightening of supply.
Moreover, the average duration of homes on the market is just nine days, suggesting that they sell quickly after listing. The 99.5% List to Sold Price Percentage, which shows that sellers are getting almost their full asking price, lends more credence to this. Now is the perfect time to sell if you plan to sell in 2024, since buyers want to relocate before the start of the new school year.
Calvert County’s median sales price rose 4.4% in comparison to the previous year. The speedy sales, high selling prices, and minimal inventories all contribute to the $465,00 median sold price. This indicates that buyers are fiercely competing with one another for available properties, which drives up market prices.
All things considered, these figures point to a seller’s market with little supply and strong demand, which is advantageous for sellers trying to get the most out of their investment. In this competitive market, buyers must be ready to move swiftly and decisively to get a property. There’s little indication that the interest rate will drop very soon, while the monthly house prices continue to rise. It may be expensive for buyers who are holding out for a drop in mortgage rates.
I’m here to help with all of your real estate needs, and I’m always happy to answer your questions. Kindly get in touch with me by phone or email.
Real estate trends in Calvert County
by Kenneth Powell | Jun 7, 2024 | Home Buyers Guide
When you’re in the market for a new home, you might come across a term that can potentially save you money and simplify the buying process: loan assumption. It’s crucial to understand what a loan assumption is, the types of loans it can assume, and the financial implications involved. This guide will help you navigate this option and decide if it’s the right fit for you.
What is a Loan Assumption?
Loan assumption occurs when a buyer takes over the seller’s existing mortgage. The buyer assumes the remaining balance, interest rate, repayment period, and other terms of the original loan. This can be particularly advantageous in a market with rising interest rates, as it allows the buyer to lock in an older, potentially lower rate.
Types of Loans That Can Be Assumed
Not all loans are assumable. In general, we can assume the following types of loans:
- FHA Loans: The Federal Housing Administration (FHA) allows loan assumptions. FHA loans are popular among first-time homebuyers due to their low down payment requirements and more lenient credit standards.
- VA Loans: Veterans Affairs (VA) loans are assumable, and you don’t necessarily need to be a veteran to assume a VA loan. However, if the new buyer is not a veteran, the original seller may lose their VA loan entitlement until the loan is fully repaid.
- USDA Loans: You can also assume the United States Department of Agriculture (USDA) loans, which are a good option for purchasing a rural home.
Financial Considerations for Loan Assumption
While loan assumptions can be beneficial, they come with specific financial considerations. The buyer must either obtain a second loan to cover the difference between the current mortgage balance and the sale price or bring enough cash to settlement to cover the difference and closing costs.
Example Scenario
Let’s say you’re buying a home for $300,000. The seller’s existing mortgage balance is $200,000, and the interest rate is lower than current market rates, making it an attractive option to assume. Here’s how you might handle the financial aspects:
- Mortgage Balance: $200,000 (to be assumed)
- Sale Price: $300,000
- Difference: $100,000
You have two options:
- Obtain a Second Loan: You could take out a second mortgage for $100,000 to cover the difference. This would mean you now have two loans to manage: the assumed mortgage and the new second mortgage.
- Bring Cash to Settlement: If you have sufficient savings, you could bring $100,000 in cash to the closing to cover the difference between the sale price and the assumed mortgage balance.
Additionally, you will need to account for closing costs, which can include fees for the loan assumption process, title insurance, and other related expenses.
Pros and Cons of Loan Assumption
Pros:
- Lower Interest Rates: If the current interest rates are higher than the seller’s mortgage rate, you could save significantly over the loan’s lifetime.
- Reduced Closing Costs: Assumed loans might have lower closing costs compared to taking out a new mortgage.
Cons:
- Large Cash Requirement: To cover the difference between the sale price and the mortgage balance, you may need significant cash.
- Second Loan Complications: If you take out a second loan, managing two separate loans can be complex and potentially more costly in terms of interest and fees.
Summary
Loan assumption can be an excellent option for homebuyers, especially in a high-interest-rate environment. Understanding the types of loans that are assumable and the financial commitments involved allows you to make an informed decision that aligns with your financial situation and homeownership goals. Always consult with a real estate professional and a mortgage advisor to explore all your options and ensure you’re making the best choice for your unique circumstances.
If you have any questions or need further assistance, feel free to contact us. We’re here to help you navigate the home-buying process with ease and confidence.

by Kenneth Powell | Jun 6, 2024 | Uncategorized
A Home Equity Line of Credit (HELOC) isn’t just a financial tool—it’s a powerful gateway to maximizing your home’s potential. Whether you’re in Calvert County, Charles County, St. Mary’s County, or anywhere in DC, Maryland and Virginia (DMV) area, a HELOC offers homeowners a flexible way to access funds by borrowing against their home’s equity. This can be a smart option for financing major expenses like home renovations, education, or other significant investments.
What is a HELOC?
A HELOC acts similarly to a credit card, giving you access to a predetermined amount of money that you can draw on as needed. Unlike a traditional loan, which provides a lump sum upfront, a HELOC offers a line of credit with a limit based on your home’s equity—your home’s value minus any outstanding mortgage balance. Typically, homeowners can borrow up to 85% of their home’s equity, though this can vary by lender.
How Do HELOCs Differ from Credit Cards?
Both offer revolving credit, but because your home’s equity backs them, lenders consider HELOCs to be less risky. This security often translates to lower interest rates compared to unsecured credit lines like credit cards, making a HELOC a cost-effective option for significant expenses.
Key Benefits and Risks of HELOCs
Advantages:
- Lower Interest Rates: Because HELOCs are secured by your home, they generally offer lower rates than unsecured loans and credit cards.
- Flexibility: You can draw funds as needed during the draw period, typically up to 10 years, paying interest only on the amount you borrow.
- Potential Tax Benefits: According to IRS guidelines, if you use a HELOC for home improvements or to buy or build a primary residence, you may be able to deduct the interest.
Risks:
- Risk of Foreclosure: Failure to repay a HELOC can lead to foreclosure, as your home serves as collateral.
- Variable Interest Rates: Most HELOCs have adjustable rates, which means payments could increase if interest rates rise.
Navigating the HELOC Process
Application Process: Similar to a mortgage application, obtaining a HELOC involves proving your creditworthiness and the value of your home. Be prepared to present documentation like W-2s, pay stubs, mortgage statements, and a credit report.
Fees and Costs: While some lenders offer no-closing-cost HELOCs, others may charge between 2% and 5% of the loan amount. Keep an eye out for annual fees and potential penalties for early closure.
Finding the Best HELOC Option
Before committing, it’s crucial to compare offers from multiple lenders. Start with your primary bank or mortgage provider—they might offer discounts or favorable terms for existing customers. Look for introductory offers that might provide lower rates at the beginning of the loan term.
When to Consider a HELOC
A HELOC is ideal for homeowners planning significant home improvements or other investments that add value to their property. However, it may not be suitable for those with unstable income or plans to move soon, as the associated costs and risks could outweigh the benefits.
HELOC vs. Home Equity Loan: Which Is Right for You?
Deciding between a HELOC and a home equity loan depends on your specific needs. A HELOC offers flexible access to funds with a variable rate, while a home equity loan provides a one-time lump sum with a fixed interest rate, which might be preferable for those needing predictable repayments.
Secure Your Financial Future with a HELOC
HELOCs offer a flexible and efficient way to use your home’s equity to your advantage. By understanding the intricacies and responsibilities involved, you can make an informed decision that aligns with your long-term financial goals. Always consult with financial advisors to ensure this approach fits your overall financial strategy.
Curious About How Much Equity You Have in Your Home?
Find out instantly with our home equity calculator:
Want to know how much equity you have in your home?
by Kenneth Powell | May 10, 2024 | Uncategorized
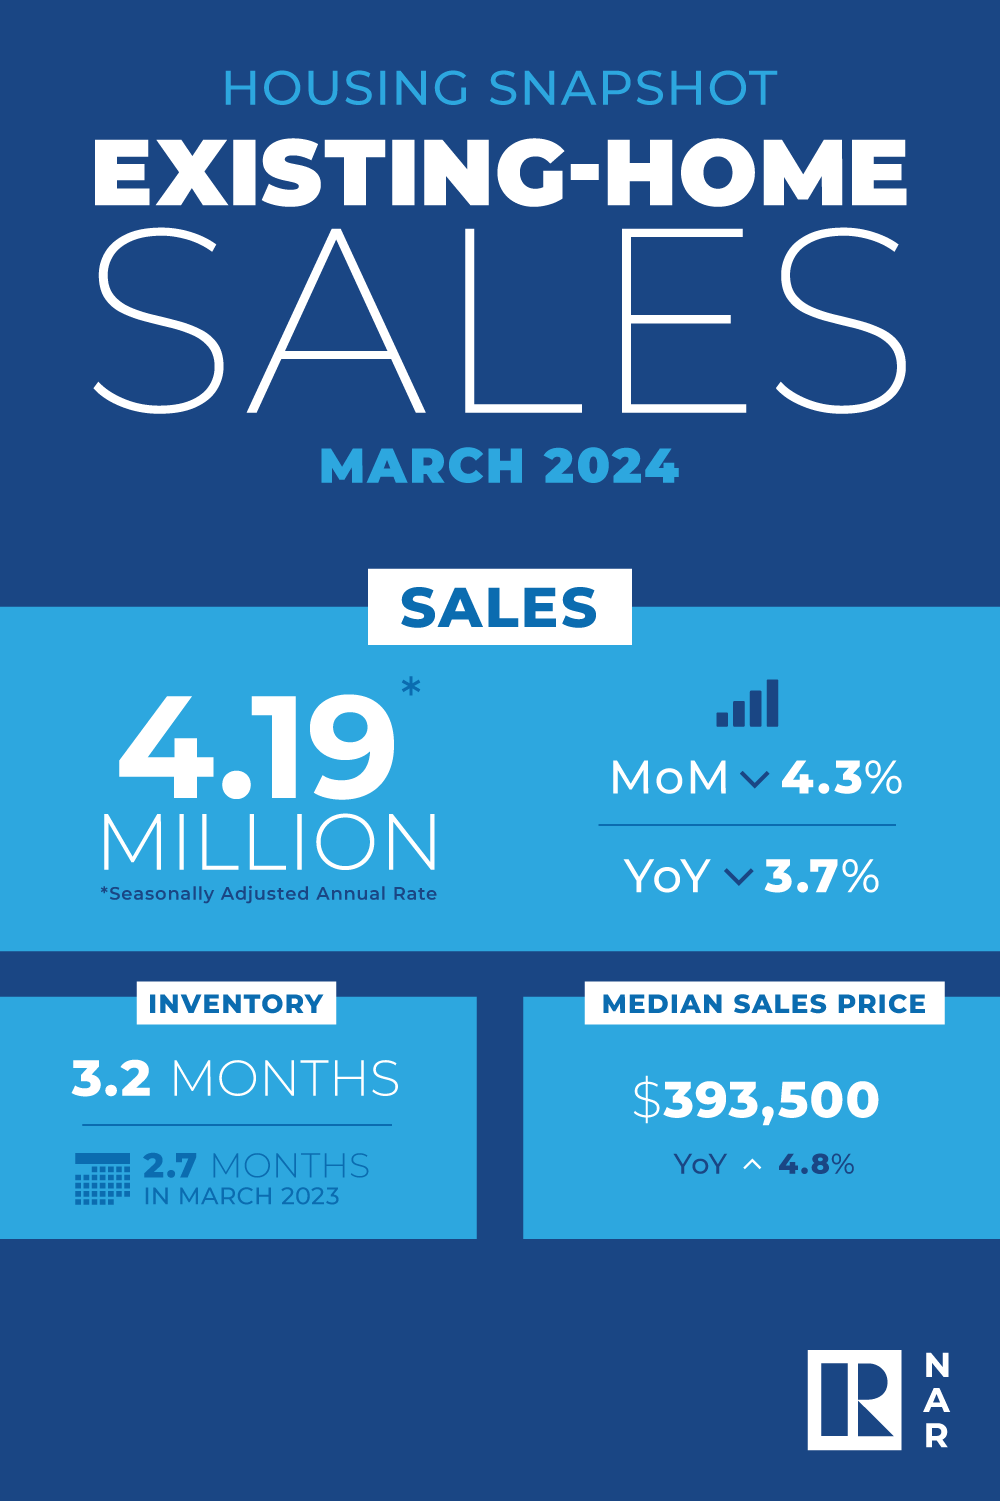
Note: Data below from March 2024 is the most recent from the National Association of Realtors.
Existing-home sales slipped in March, according to the National Association of REALTORS®. Among the four major U.S. regions, sales slid in the Midwest, South and West, but rose in the Northeast for the first time since November 2023. Year-over-year, sales decreased in all regions.
Total existing home sales – completed transactions that include single-family homes, townhomes, condominiums and co-ops – receded 4.3% from February to a seasonally adjusted annual rate of 4.19 million in March. Year-over-year, sales waned 3.7% (down from 4.35 million in March 2023).
 “Though rebounding from cyclical lows, home sales are stuck because interest rates have not made any major moves,” said NAR Chief Economist Lawrence Yun. “There are nearly six million more jobs now compared to pre-COVID highs, which suggests more aspiring home buyers exist in the market.”
Total housing inventory registered at the end of March was 1.11 million units, up 4.7% from February and 14.4% from one year ago (970,000). Unsold inventory sits at a 3.2-month supply at the current sales pace, up from 2.9 months in February and 2.7 months in March 2023.
“More inventory is always welcomed in the current environment,” Yun added. “Frankly, it’s a great time to list with ongoing multiple offers on mid-priced properties and, overall, home prices continuing to rise.”
The median existing-home price for all housing types in March was $393,500, an increase of 4.8% from the previous year ($375,300). All four U.S. regions registered price gains.
According to the REALTORS® Confidence Index, properties typically remained on the market for 33 days in March, down from 38 days in February but up from 29 days in March 2023.
First-time buyers were responsible for 32% of sales in March, up from 26% in February and 28% in March 2023. NAR’s 2023 Profile of Home Buyers and Sellers – released in November 20234 – found that the annual share of first-time buyers was 32%.
All-cash sales accounted for 28% of transactions in March, down from 33% in February but up from 27% one year ago.
Individual investors or second-home buyers, who make up many cash sales, purchased 15% of homes in March, down from 21% in February and 17% in March 2023.
According to Freddie Mac, the 30-year fixed-rate mortgage averaged 6.88% as of April 11. That’s up from 6.82% the previous week and 6.27% one year ago.
Regional Breakdown
Existing-home sales in the Northeast climbed 4.2% from February to an annual rate of 500,000 in March, ending a four-month streak where sales in the Northeast registered 480,000 units. Compared to March 2023, home sales were down 3.8%. The median price in the Northeast was $434,600, up 9.9% from one year ago.
In the Midwest, existing-home sales retracted 1.9% from one month ago to an annual rate of 1.01 million in March, down 1.0% from the prior year. The median price in the Midwest was $292,400, up 7.5% from March 2023.
Existing-home sales in the South faded 5.9% from February to an annual rate of 1.9 million in March, down 5.0% from one year before. The median price in the South was $359,100, up 3.4% from last year.
In the West, existing-home sales slumped 8.2% from a month ago to an annual rate of 780,000 in March, a decline of 3.7% from the previous year. The median price in the West was $603,000, up 6.7% from March 2023.
by Kenneth Powell | Apr 7, 2024 | Uncategorized
Note: Data below from February 2024 is the most recent from the National Association of Realtors.
Existing-home sales climbed in February, according to the National Association of REALTORS®. Among the four major U.S. regions, sales jumped in the West, South and Midwest, and were unchanged in the Northeast. Year-over-year, sales declined in all regions.
Total existing home sales – completed transactions that include single-family homes, townhomes, condominiums and co-ops – bounced 9.5% from January to a seasonally adjusted annual rate of 4.38 million in February. Year-over-year, sales slid 3.3% (down from 4.53 million in February 2023).
 “Additional housing supply is helping to satisfy market demand,” said NAR Chief Economist Lawrence Yun. “Housing demand has been on a steady rise due to population and job growth, though the actual timing of purchases will be determined by prevailing mortgage rates and wider inventory choices.”
Total housing inventory registered at the end of February was 1.07 million units, up 5.9% from January and 10.3% from one year ago (970,000). Unsold inventory sits at a 2.9-month supply at the current sales pace, down from 3.0 months in January but up from 2.6 months in February 2023.
The median existing-home price for all housing types in February was $384,500, an increase of 5.7% from the prior year ($363,600). All four U.S. regions posted price increases.
According to the REALTORS® Confidence Index, properties typically remained on the market for 38 days in February, up from 36 days in January and 34 days in February 2023.
First-time buyers were responsible for 26% of sales in February, down from 28% in January and 27% in February 2023. NAR’s 2023 Profile of Home Buyers and Sellers – released in November 2024 – found that the annual share of first-time buyers was 32%.
All-cash sales accounted for 33% of transactions in February, up from 32% in January and 28% one year ago.
Individual investors or second-home buyers, who make up many cash sales, purchased 21% of homes in February, up from 17% in January and 18% in February 2023.
According to Freddie Mac, the 30-year fixed-rate mortgage averaged 6.74% as of March 14. That’s down from 6.88% the prior week but up from 6.60% one year ago.
Regional Breakdown
At 480,000 units, existing-home sales in the Northeast were identical to January but down 7.7% from February 2023. It’s the fourth consecutive month that home sales in the Northeast registered 480,000 units. The median price in the Northeast was $420,600, up 11.5% from one year ago.
In the Midwest, existing-home sales propelled 8.4% from one month ago to an annual rate of 1.03 million in February, down 3.7% from the previous year. The median price in the Midwest was $277,600, up 6.8% from February 2023.
Existing-home sales in the South leapt 9.8% from January to an annual rate of 2.02 million in February, down 2.9% from one year earlier. The median price in the South was $354,200, up 4.1% from last year.
In the West, existing-home sales skyrocketed 16.4% from a month ago to an annual rate of 850,000 in February, a decline of 1.2% from the prior year. The median price in the West was $593,000, up 9.1% from February 2023.
“Due to inventory constraints, the Northeast was the regional underperformer in February home sales but the best performer in home prices,” Yun added. “More supply is clearly needed to help stabilize home prices and get more Americans moving to their next residences.”